In technical analysis, understanding the flow of liquidity and the measurement of buying and selling pressure is essential to detect the process. The A/D indicator, or a compact/distribution/distribution line, makes it easier to do so. This article is dedicated to the A/D indicator training and will help you find a more comprehensive view of market trends by examining how to calculate, ascending and descending signals, and its combined use with other indicators.
What is the A/D indicator or the density/distribution line?
A/D indicator, or density/distribution line, is a volume -based indicator used to measure purchase or sale pressure in an asset. By examining the relationship between price and volume of transactions, this indicator shows whether the asset is density (purchasing by large investors) or distribution (sales by large investors).
The A/D indicator is drawn as a line on the chart. This line climbs when there is a purchase pressure and decreases if sales pressure. The purpose of this indicator is to determine whether an asset is being purchased or being sold by examining the relationship between price and volume. It can also be used to identify divergence between the indicator and the price of assets; Diverse that may be a sign of a possible return of the process.
The density/distribution line (A/D) is designed by Marc Chaikin to specify the flow of money or exit money into an asset. This indicator should not be confused with the Advance/Decline Line.
Despite the nominal resemblance, these two tools are quite different and their users are different. The line of progress/registration provides an insight into the overall market movements, while the compression/distribution line is used for traders seeking to measure purchasing or selling pressure on an asset or confirming the power of a trend.
This indicator, similar to VWAP, is of cumulative type; That is, it can be attached to a particular point in time such as the recent roof or oscillating floor to get more accurate information.
Read more: What is the indicator
Application of A/D Indicator in transactions
In this section, we examine two main strategies based on density/distribution indicator:
1. The process identification
In general, there are four main types of trends in the market, each of which has a specific market behavior. The trends can be identified with the help of A/D indicator.
Continue the upward trend
If an asset is in the uptrend, the A/D line should also move upwards. To confirm this process, look for the formation of higher ceilings in the A/D line. If the A/D line is rising while the price is stabilized or corrected, this may indicate the continuation of the upward trend.
Continue the downward trend
If an asset is in the downtrend, the A/D line should also be descending. To confirm the downtrend, look for the formation of lower floors in the A/D line. Reducing the A/D line while the price is stabilizing or ascending minor correction can be a sign of a downward trend.
Resistance Failure (Breakout)
Resistance failure or Brake August occurs when the price passes through an important resistance level. In this case, the A/D line should also move upwards. If this line rises simultaneously with rising prices, it confirms that there is actual purchase pressure and supports failure.
Read more: What is Brake August
Supported failure (Breakdown)
Support failure or breakdown fails when the price breaks down an important support level. In this case, the A/D line should also be descending. If this line declines at the same time as the price drop, it indicates that there is real sales pressure and the downward failure will be confirmed.
Read more: What is Brake Down
2. Identify divergence
Here’s how to use the A/D indicator to identify divergences.
Bullish Divergence)
This happens when the price of assets is forming lower floors, but the A/D line makes higher floors. This mode indicates that purchasing pressure is increasing, even with price drops; That can be a sign of a possible return of the process.
Bearish divergence (bearish
Downt divergence occurs when the price is forming higher ceilings, but the A/D line records lower ceilings. This indicates an increase in sales pressure, even with rising prices. This item may be a sign for a possible return of the trend.
The benefits of the A/D indicator
A/D indicator, like any other technical analysis tool, has benefits and limitations. In this section, we will examine the benefits of using this indicator in trading strategies.
The numerical display of market emotions
The A/D indicator provides valuable insight into market emotions by analyzing the relationship between price and volume. By identifying sales and sales pressure, this indicator helps traders better understand market dynamics and make more informed trading decisions.
Simple readability
Indicator A/D is a simple and straightforward tool that is easy to read and understand. Traders can quickly analyze the A/D line and identify the trends and opportunities for potential purchase or sale.
Compatibility with other indicators
The A/D indicator can be used along with other technical indicators such as moving averages, oscillators and process lines to confirm the signals and increase the accuracy of transactions. By combining different indicators, traders can develop a more comprehensive and reliable trading strategy.
Disadvantages of Indicator A/D
The A/D indicator also has some limitations despite its benefits. In this section, we will examine the disadvantages of using this indicator in trading strategies.
Failure to pay attention to price changes over different time intervals
The A/D indicator only focuses on the current period and does not consider the price changes from one period to the next. This can lead to incomplete interpretation and the wrong signal.
To fix this restriction, some traders use a copy of the A/D indicator, which also includes the moving average, which can pave the way and provide a more accurate image of the price and asset volume over time.
Limited to specific assets
The A/D indicator is the most effective on assets with high volume and high liquidity. Assets that have low liquidity and trading volume may not provide accurate signals from the A/D indicator.
Delay
The A/D indicator is a delayed indicator, meaning that it follows price movements and does not give an advanced warning of changes. Traders should use this indicator along with other leading indicators.
Calculate the A/D indicator
The first step to drawing a compression/distribution line in the A/D indicator is to calculate the “Close Location Value” or CLV. This value examines the closure price position compared to the price range of a period (eg one day, week or month). The CLV value is always the number between the positive one and the negative one:
- If the CLV value is zero, it means that the price is closed in the middle of the highest and lowest price.
- The +1 value indicates the price closure at the highest level.
- Value -1 indicates that the price is closed at the lowest level of the period.
The CLV calculation formula is as follows:

Where:
- C: The price of closing
- H: The highest price in the period
- L: The lowest price in the period
After calculating the CLV, this value is multiplied by the volume of transactions of the same period. The result of these beats is rallied and forms a compression/distribution line.
Tutorial on signal receiving from indicator A/d
The density/distribution line (A/D) can produce both bullish and bearish signals. These signals are usually based on divergence or approval of the process.
Ascending signals
Ascending signals appear when the price of an asset is declining or in the downtrend, but the A/D line is upward (see below). This divergence indicates an increase in purchasing pressure, which can indicate the weakening of sellers’ power. In many cases, this situation leads to a change in price trend from downtrend.

The above sample chart shows well that the A/D line is increasing, while the asset price is still in the downtrend.
Descending signals
The descending signal is formed when the density/distribution line (A/D) has a downward trend, but the asset price is in an uptrend. This situation indicates an increase in sales pressure, which will usually be a sign of the beginning of a possible downward trend in the future.

The chart above shows that the A/D line is declining, while the asset price continues to rise. Although this divergence is in the early stages, what should be considered is the price distance from the A/D line.
Identify divergence
In order to detect descending or ascending signals, the existence of a specific trend in the basic asset must be confirmed. After that, look for divergence of it. When identifying these divergences, both ascending or descending, it is best to take the signals for a while to form properly.
As for patterns, be sure to consider smooth or without specific divergence signals; Because these symptoms can indicate that the trend is not changed in the future.
A/D indicator combination with different indicators
To get more accurate analysis and reduce the wrong signals, traders often combine density/distribution (A/D) with other technical analysis tools. This combination helps them to better identify trends and have more reliable entry and exit points. Here are some of the most commonly used indicators along with A/D.
Indicators of Money Flow (MFI)
The Money Flow Index is one of the volume -based faithic indicators, which is usually calculated in a 2 -day interval. This tool compares the flow of input money (purchase) with the output (sales) money flow to evaluate the strength or weakness of the current trend of an asset.
Read more: What is the index of money flow
MFI fluctuates between 1 and 2:
- When the MFI value reaches nearly 1 (usually about 1), the asset is in the saturation status of the purchase.
- When the value reaches zero (usually about 1), it shows the status of Oversold.
The MFI combination with density/distribution can provide more powerful signs of buying or selling pressure.
Relative Power Index Indicator (RSI)
Relative Power Index Index (RSI) is a believable oscillator that is calculated by comparing the amount of recent profits of an asset with its recent losses. This numeric indicator represents between 1 and 2 and is used as MFI to identify the saturation of the purchase and saturation of the sales.
Read more: What is the relative power index of RSI
- The RSI value above 2 indicates the saturation of the purchase.
- Lower than 1 usually means saturation of sales in the market.
The combination of RSI with density/distribution indicator (A/D) helps analysts to examine the divergence and process verification signals more carefully.
Composition
The use of density/distribution (A/D) is possible alone, but if we combine it with indicators such as MFI or Relative Power Index (RSI), the analysis accuracy will increase. Because the MFI and RSI have a numerical range, they can specify the saturation of the purchase or sales that A/D cannot only detect.
While both RSI and MFI indicators have a similar goal, identifying extremist market conditions, their method is different:
- MFI examines the flow of money and outflows, whether positive or negative.
- RSI compares the recent profits and losses of an asset.
Because these tools do not overlap, they can be used as supplements alongside A/D and provide a more accurate image of the market.
An example of the performance of line A/D
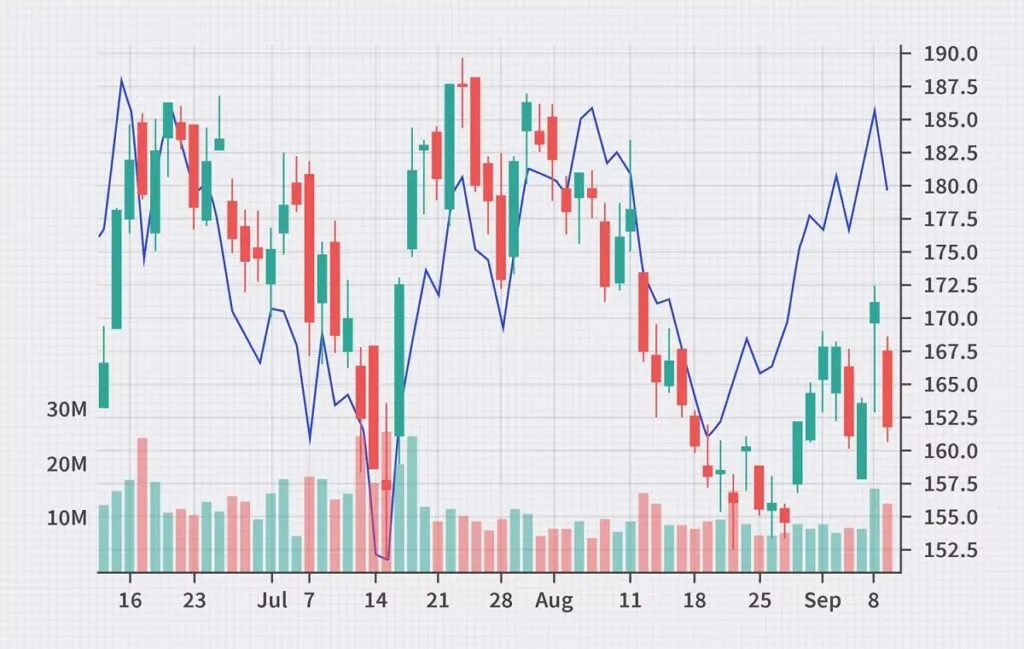
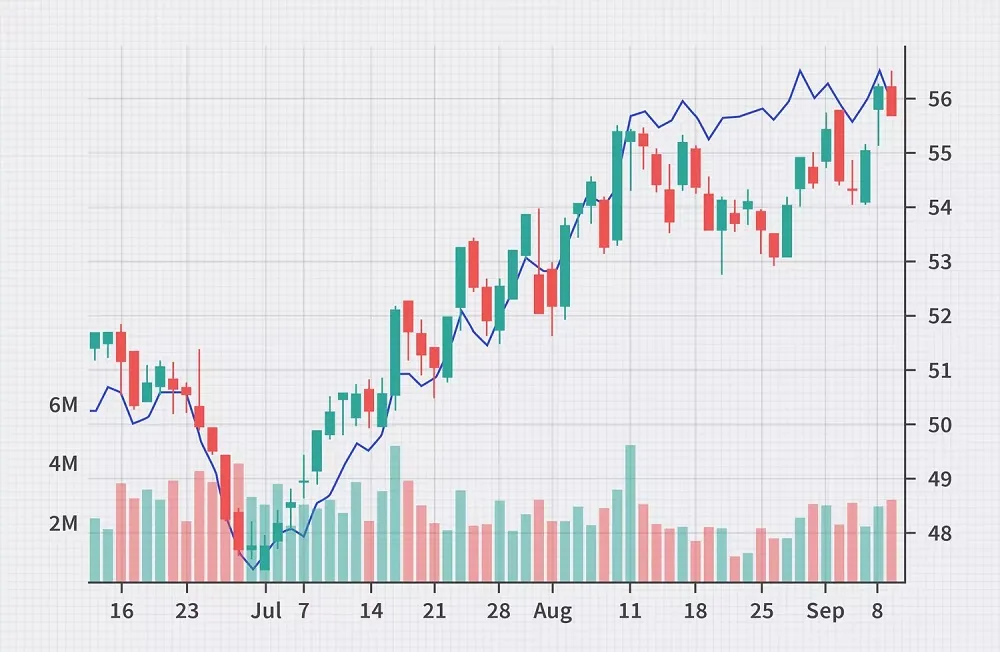
The following chart can see a clear example of the validity of the compression/distribution line. While the price trend continues to rise, the A/D line remains at the same time as it is at the same time, indicating that the process is powerful and durable.

Even when the price drops slightly on August 1, the A/D line still shows purchasing power. This convergence between price and volume assures us that the uptrend is not temporary and that the price will soon be back to its uptrend, which will happen.
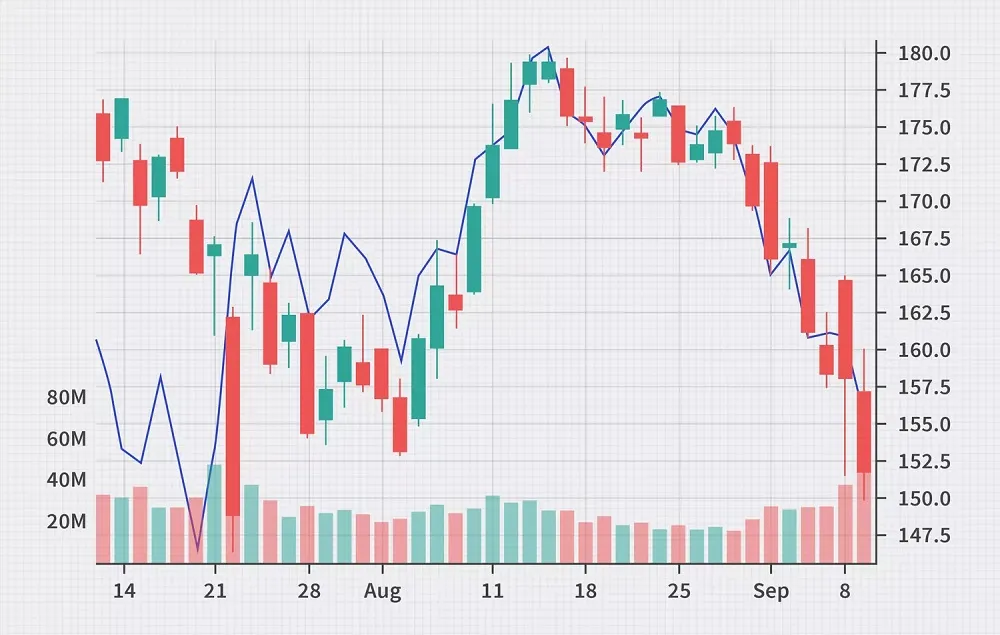
In another example (the chart below), the density/distribution line (A/D) plays a qualifying role both in the uptrend and the downward trend.

In the right side of the chart, we see that the price begins to follow the signal that the A/D line presented in August. This behavior shows that sales pressure is increasing and the A/D line has shown the price earlier. Such a match between the price and the A/D line can be an effective tool for continuing trends for traders.
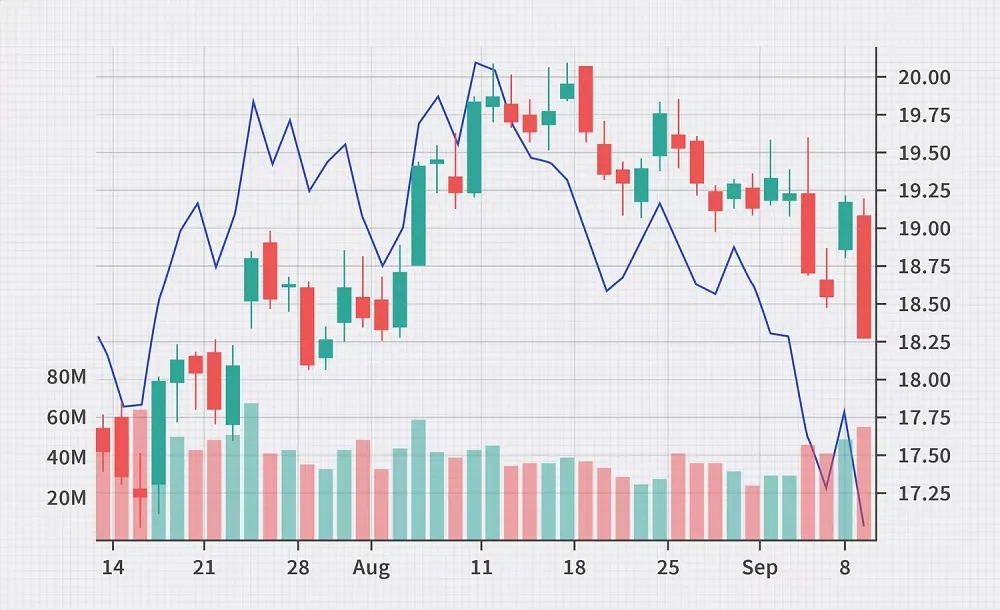
In the chart below, we can see that the density/distribution line is fully consistent with the price trend. The price is in a downward trend and the A/D line has confirmed the sales pressure.

At the same time as prices continue to decline, the A/D line shows that sales pressure is still in place. In the latest data in the chart, the downward trend of A/D line confirms that this situation continues. This alignment between the price and A/D helps the analyst to make sure the downtrend is credited.
Comparison of A/D indicator and obv
The density/distribution indicator or A/D and the equilibrium volume (On-Balance Volume or OBV) are both tools that operate on the volume of transactions but have a different approach.
Designed by the financial author, Joe Granville, the OBV indicator works based on the volume cumulative flow in an asset. In this way, if the closure price is higher than the previous closure price, the volume of that day’s trading will be added to the sum, and if the volume is lower, the volume will be deducted. This positive and negative volumes eventually form the OBV line, which is used to evaluate divergence or confirm the price trend.
In contrast, the density/distribution indicator focuses on comparing the location of the closing price with the high-end domain over the same period and does not interfere with the previous closure price. This difference makes A/D more accurate reaction to the distribution of sales and sales at the interval.
Frequently asked questions
The A/D indicator is used to identify the purchase or sale pressure and verify the asset price trend.
Yes, but its combination with indicators such as RSI or MFI provides more accurate analysis.
For assets with high volume of transactions and appropriate liquidity, such as stocks or pairing pairs.
Conclusion
The density/distribution indicator (A/D) is a practical tool for identifying buying and selling pressure in an asset and also helping to verify existing trends. This indicator can be used alone to analyze, but its strength increases when it is combined with tools such as MFI or RSI. This combination gives the trader a more accurate view of the market situation.
Since RSI and MFI determine the saturation of the purchase or sales well, using them along with A/D provides a more comprehensive image of price and volume. Overall, the A/D indicator can lead to a more complete technical analysis along with other tools. This tool has a special place in the boxer of every professional trader.
RCO NEWS


