The Aroon Indicator, sometimes referred to as Aroon Up down, is made up of two lines called Aaron Up or Aaron Down or Aron Down. The traders use this indicator to measure the suffering phase or trend in the market and its power.
Aaron indicators can be used in the technical analysis of all financial markets, including digital currency, to identify the points of change, start and end of the trend, process or market suffering, reform points and phase of consolidation, as well as measure the power of the trend if it is in the market. In this article, we will teach the formula of calculating, how to draw a video and trading strategies based on the upward and descending Aaron indicator.
What is Aaron Indicator?
Aaron indicator, also called Aroon Up down, is a technical analysis tool consisting of two upper and lower Aaron lines. The lines of this indicator fluctuates between 1 and 2, and they can identify the trend and trend power in the market. Aaron lines are also known as Bullish Aroon and Bearish Aron.
Read more: Introducing Types of Analysis in the Digital Currency Market
Aaron’s design history and initial assumptions
The Aroon System system was designed by Tushar Chande in the year 2 with the aim of identifying the end of the current trend and starting a new trend. The secondary and sub -use of this index is more for the power detection of the trend.
The initial assumption of this indicator is that in an uptrend, usually any new price is closed above the previous price and records a new Higher High. Similar to the same initial assumption for the Aaron index in a downward trend; The new price usually closes lower than the previous price and records a new or lower floor.
Read more: What is the process
Auron’s Indicator Features and Applications in Technical Analysis
This index is different from other belt -ocelaterals and focuses more on the ratio of time to price, than the price -to -time ratio. Among the most important applications of the ARON indicator are:
- Identify the points of change or start and end of the process
- Identifying the existence of a trendy or neutral market (Range)
- Identifying corrective return or phases of consolidation (consolidation)
- The strength of the trend if it exists
Read more: What is a technical analysis
Aaron Indicator Calculation Formula
As we said, the Aaron index is made up of two lines called Aaron high or ascending and low or descending Aaron and plotted under the price chart.

Aroon up line
Aaron above indicates the number of days since the last price ceiling is recorded over a specified timeframe. In analytical platforms and chart drawing, this line is usually displayed in orange or yellow. The Aroon UP calculation formula is as follows:
× × Number of Period Days / (Number of Days After Last Higher Price Ceiling – Number of Period Days) = Aaron High
For example, if we consider the period of the 4 -day period, the Aaron line will review the number of days since the last price ceiling was recorded in the last 7 days and calculates a number of 1 to 2.
Aroon Down line
Aaron below also shows the number of days since the last price of the price has been in a specified period of time. In analytical platforms and chart drawing, this line is usually displayed in blue. The Aroon Down Formula is as follows:
× × Number of Period Days / (Number of Days After Last Floor Price – Number of Days) = Aaron Low
For example, if we consider the 4 -day course, the lower Aaron line examines the number of days since the last price of the price has been in the last 7 days and returns a number of 1 to 2.
How to interpret the Aaron indicator signals
The amount of Aroon Up and Aroon Down formula in the Aaron index and how these lines are placed under the price charts can have different interpretations.
Trend detection
In order to know if there is a process at all, we need to pay attention to the location of the lines to each other and their proximity to the values 1 and 2:
- If the Aaron UP value is above 1 (above 1 in ideal mode) and the value of Aaron Down below (below 1 in ideal mode), we have an upward trend.
- If the value of the Down Down is above 1 (above 2 in ideal) and the Aaron UP value is below 1 (below 1 in the ideal mode), we have a downward trend.
- If the value of both Aaron Up and Down is equal to 2, that is, the ceiling or price floor, it has happened exactly in the intended half interval. For example, during a 2 -day period with Aaron Up, that is exactly the previous 2 days, the previous price ceiling has been recorded.
- If both Aaron Up and Down are on 2, it means the market is neutral and we have no definite trend.
- The Aroon Up line above the Aroon Down line is the uptrend.
- The Aroon Down line above the Aroon Up line is the downward trend.
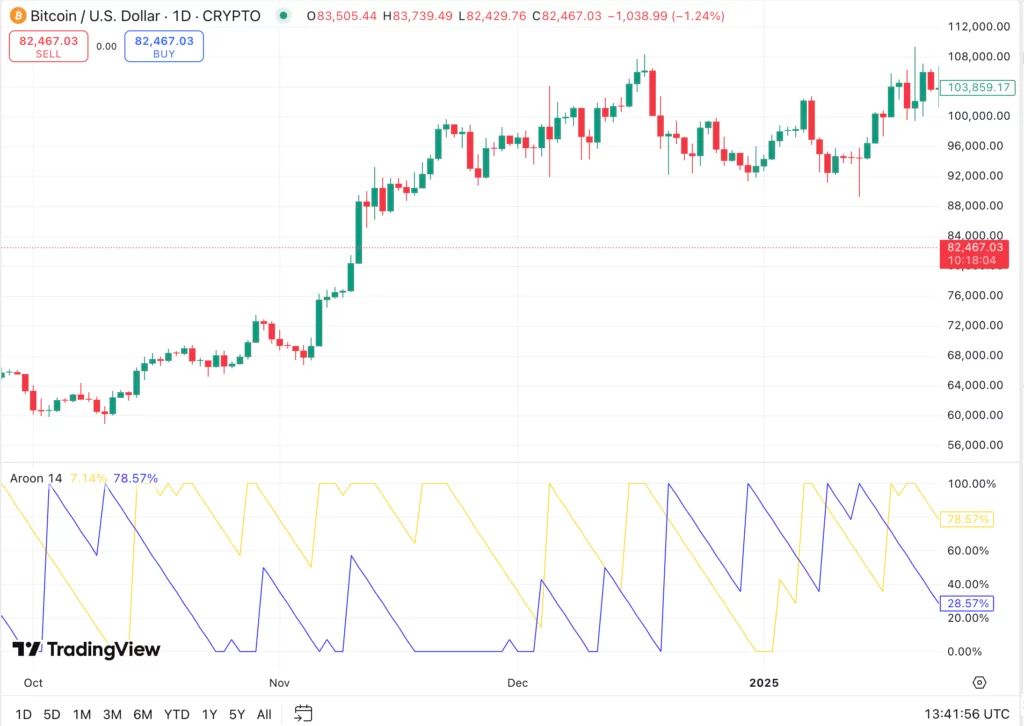
In the picture below, between mid -October and mid -December is the Aroon Up above the Aroon Down line and the price trend is upward.
The strength of the trend
The closer the amount of lines to 1, the stronger the process is: the stronger the process is: the stronger the process is:
For Aaron Up:
- Above 1 – a strong upward trend
- Between 1 and 2 – growing upward trend
- Between 1 and 2 – a weak uptrend and on the verge of fatigue
- Below – the trader’s interest in buying and raising prices
For Aaron Down:
- Above 1 – a strong descending trend
- Between 1 and 2 – growing downward trend
- Between 1 and 2 – the downward trend of fatigue
- Below – lack of interest in selling and reducing prices
Example
For example, if we consider the course for 2 days and 5 days have passed since the last ceiling registration, the Aroon UP line value will be 1.2, which indicates the likelihood of an upward trend.
1.2 = 1.2 / (1 – 2) = Aaron High
Now if our current price itself is the highest price in our desired period, the high Aaron line in this indicator will be equal to 1, indicating a very strong upward trend:
1 = ۱۰ ۱۰ / (1 – 2) = Aaron High
Parallel movement of the lines
If both the parallel and Down lines move each other, that is, the process is unclear and it is not possible to determine the entry point. This means we are in the phase of consolidation and we have to wait until the process and price failure is determined.
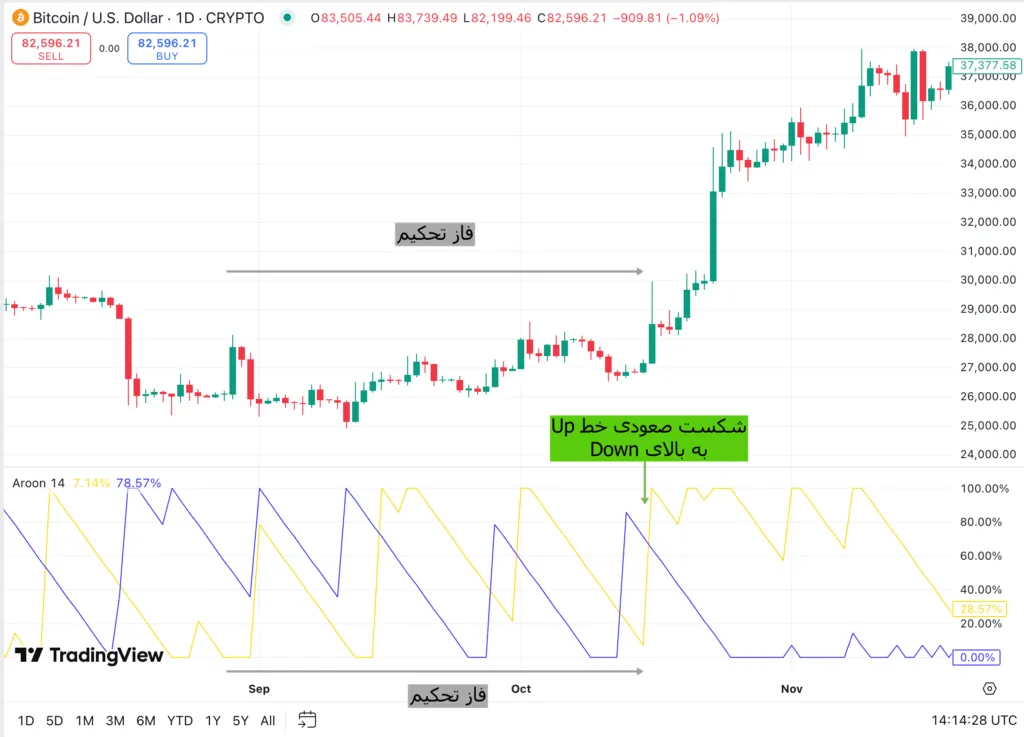
In the picture below, from early September to mid -October, the up and down lines have been almost parallel in different intervals. During this period, in the high price chart we also see a neutral and neutralized price of bitcoin. Subsequently, the yellow line owned by Aaron Up has grown sharply and has exported the ascending market to the start of the market as it reached.

The intersection of Aaron lines up and down
Another of the most important events in the movements of the Aaron and Down lines is their crossover intersection. Traffers usually consider the intersection between these lines as one of the signals of entry and exit in transactions.
If the Down line passes through the UP line and moves up, that is, the likelihood of a downtrend is likely to start and the signal of sales is. In contrast, crossing the UP line to the top of the down line (blue) can indicate the start of the upward trend and a signal of purchasing.
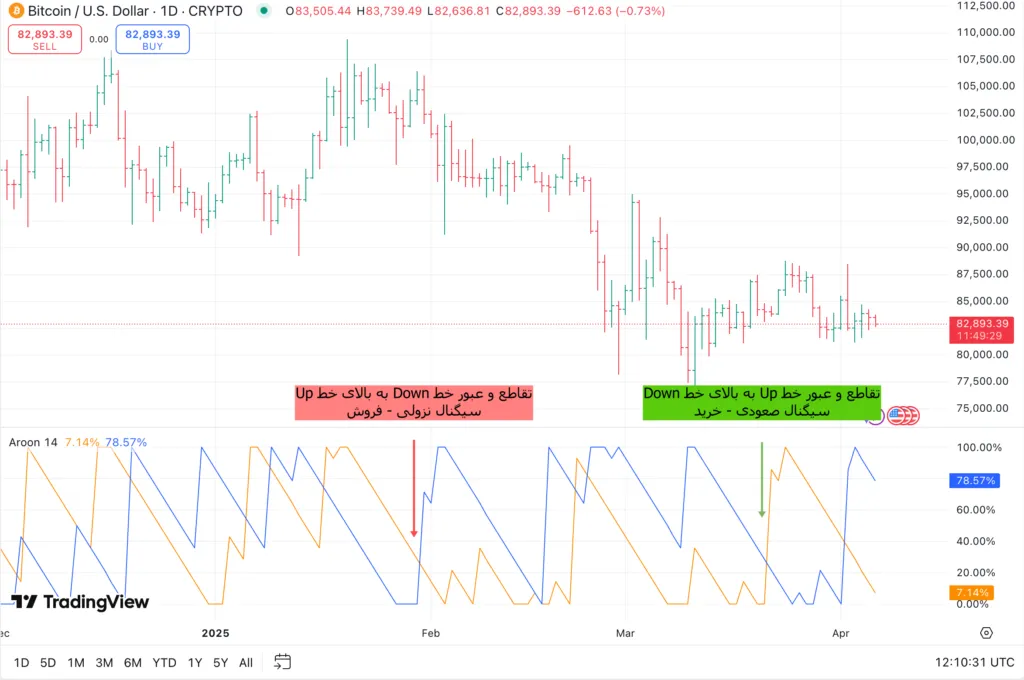
As we said, when both of these lines are below 1 and are below 1, there is no definite trend and we are in the phase of consolidation. There are no new ceiling and floors during this period.
Repeated intersections
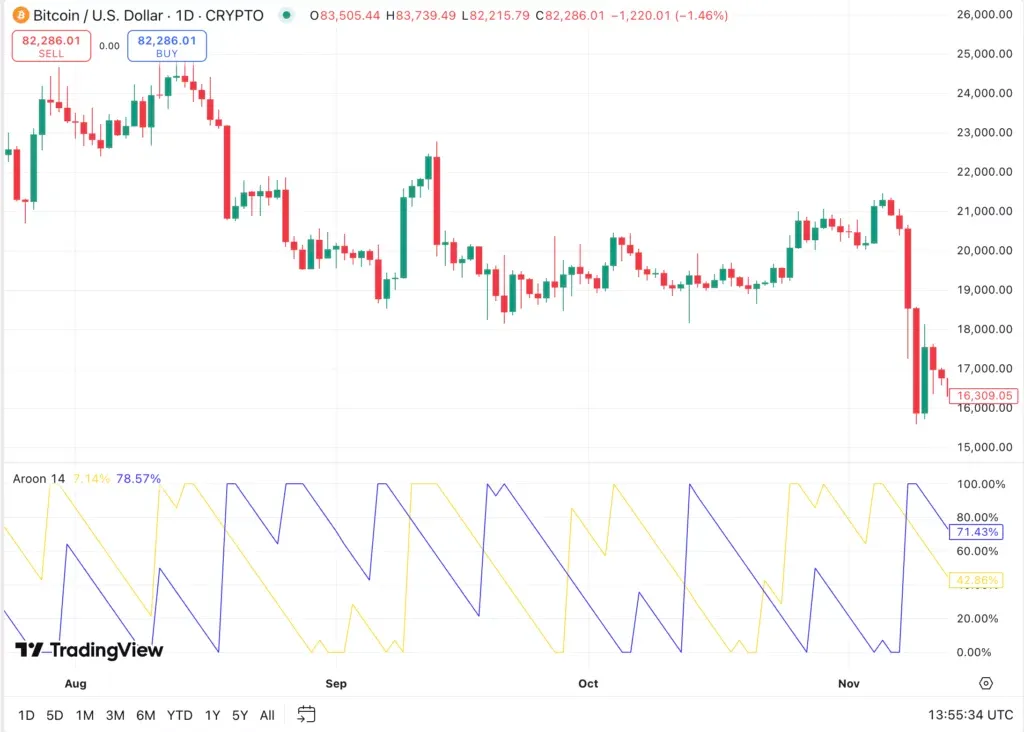
Repeated intersections between the two lines of the Aaron indicator also indicate a balance between supply and demand, which generally leads to the creation of a neutral and neutral market.
For example, in the picture below, from the second half of August to early November, we see the intersections of the up and down lines over each other. As you can see in the price chart, Bitcoin has passed a neutral phase during this time.
Credit and how to verify the Aaron indicator signals
Sometimes very high values for up and down lines, especially about 2, are the initial alerts to return and change the trend. If the line remained nearly for a while, analysts similar to the RSI interpretation see it as a sign of saturation of the purchase and the possibility of market descending. On the contrary, if the Down line spends a while nearly, it is considered a sign of saturation of the sales and the possibility of starting an upward trend.
However, before the start of trading, you must confirm the issued signals. While the values of nearly 3 indicate the saturation of the purchase or saturation of the sales, the market is likely to remain in the current situation and continue to record higher ceilings or lower floors in the same direction.
To verify the validity of the issued signals, it is best to consider price action analysis and increase in transactions. Usually, the increase in the volume of confirmation transactions is to start the new trend or continue the previous trend. The combination of this index with other indicators is also a good way to verify the validity of the signals issued.
What is the best Aaron indicator settings?
One of the most important discussions among traders is to determine the time period to measure the trendy or neutral market. There are two common adjustments for the period and time in the Aaron index computing formula, each with its own advantages and disadvantages:
- Volume 1A: This adjustment is more sensitive and provides signals faster, which is more suitable for short -term traders. However, this more sensitivity can lead to increased false signals.
- Volume 1A: This adjustment makes the data smoother and is more suitable for analyzing long -term trends. In this case, the signals may appear more delay, but they are more likely to be accurate.
In general, the choice between these two periods depends on your trading goals and your risk tolerance. If you are looking for short -term transactions and you can accept the risk of incorrect signals, the period 2 is more appropriate. But if you prefer to follow the long -term trends and get safe signals, Course 2 will be a better option.
Training on how to use the practical use of Aaron Indicator in Trading View
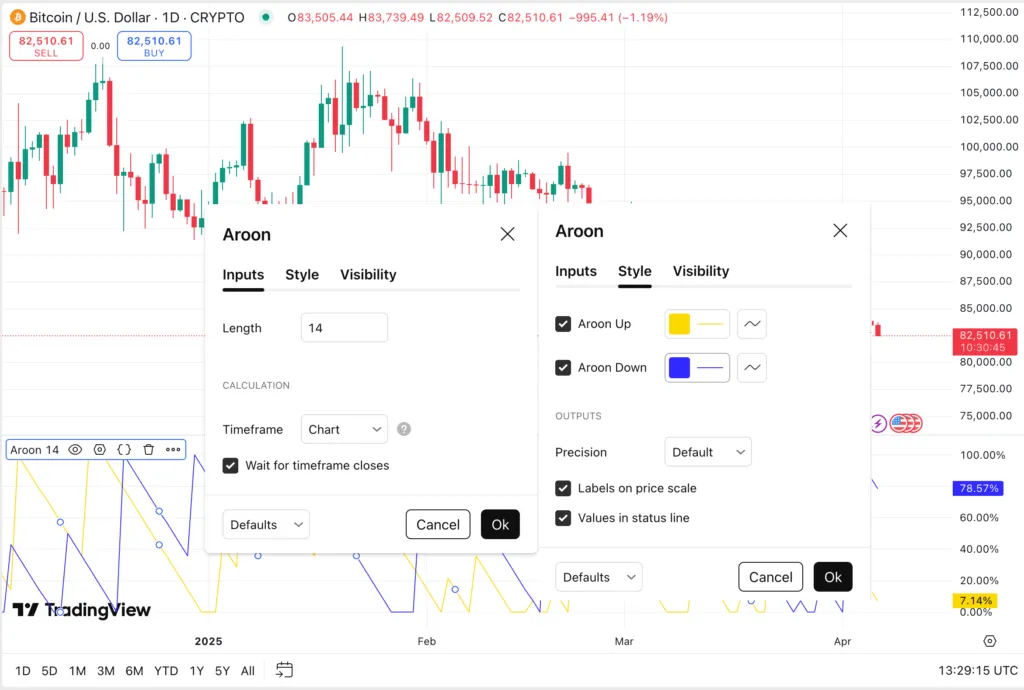
To draw Aaron’s technical index in TradingView, just visit its website and create an account. After that, open the price chart, for example, open the bitcoin price chart.
Read more: What is Trading View?
Next, from the toolbar at the top of the page, click “Indicators” and search for “Aroon”. Select the same first option. The blue line below the price chart is the Aroon Down and the yellow line is for the Aroon Up.

Tutorial on changing the AROON Indicator Settings in Trading View
To change the settings of this indicator, such as the computing period or color and the appearance of the lines, click one of them to open its toolbar. Click on three areas and select “Settings” from the popup window.
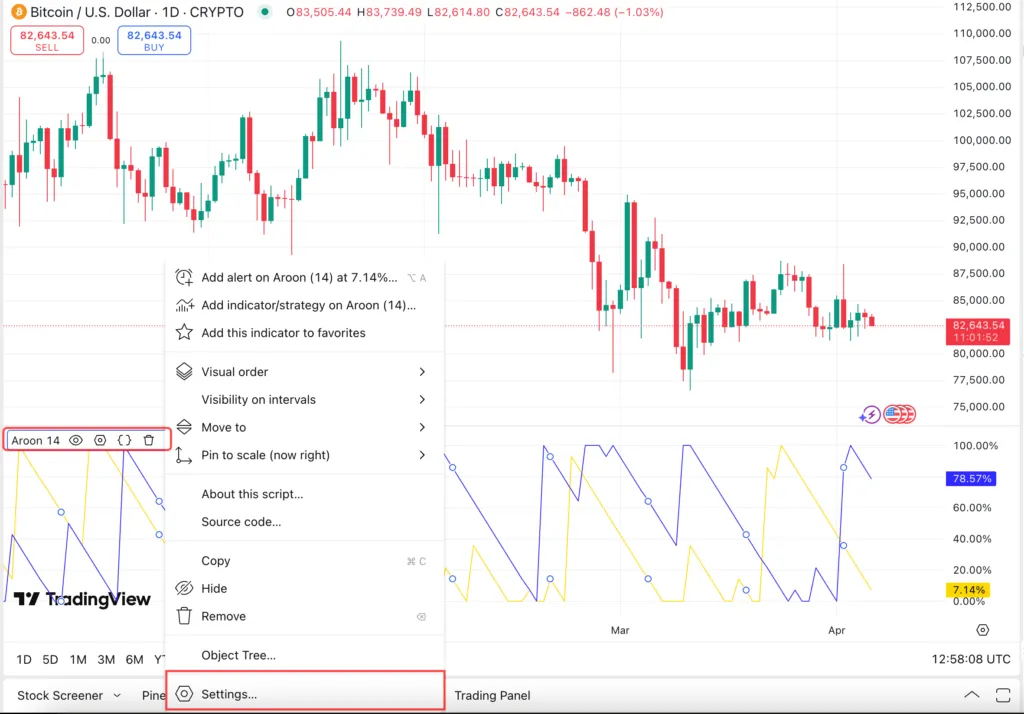
The following window opens. From the “inputs” tab you can change the course from 1 to other custom settings such as 1. From the “Style” tab, it is also possible to change the color of the up and down lines and other appearance of these lines.
Read more: Vivo Training Training
Trading and trading strategies with Aaron indicator
There are two general strategies, including the Breke Over and the power of the Aroon Index, which we will teach them how to implement them.
Breakout Trading Strategy (Breakout Trading Strategy)
Most of the trading strategies based on the Aaron indicator focus on entering the transaction when the market trend change suddenly. As we said earlier, the parallel movement of the Aaron and Down lines, as well as the recurrent intersections between them, reflects the price consolidation phase, and this may be accompanied by a failure and a breakthrough. In such circumstances, to enter the transaction, you have to wait for the upward or downward defeat and then enter the new process.
The steps are as follows:
- Identifying the phase of consolidationA: When both Aaron lines move in parallel or have repeated intersections, it is a sign of a neutral market.
- Waiting for a failure signal in Aaron indexA: When one of the other lines is cut off and moving over it, the Brake Signal and failure appear.
- Receive signal confirmationA: In order to ensure that the intersection of a signal is not wrong and false, the price of the price channel borders must also be confirmed. For example, if we have an increase in volume of transactions or the price of the price, the price crosses the top of the channel and closes on top.
- Login to the transaction in the direction of failure: If the line fails is up, enter the shopping position and if it is down, enter the sales position.
Example: In the Bitcoin chart, the up -line and Downline have had parallel movements, and the intersection has occurred several times. In the price chart you also see the neutral bitcoin movement. Then, the Aaron UP line moved from the bottom to the top of the Down line and retained its about 2 for a few days. Because in this area we have both high shade and increased trading volume, the purchase signal is valid and we enter the purchase position.
Trend Power Strategy (Trend Strength Strategy)
When the trend is powerful, the Aaron lines usually remain near their upper levels, and traders use this feature to identify strong trends and make profit.
How to run:
- When the Aaron -up line reaches Level 2 or more and the Down Aaron line reaches level 2 or less, there is a possibility of a strong upward trend.
- The direction of the process is determined by the last intersection of Aaron lines.
- You enter the position in the process and leave the transaction when the Aaron lines cut each other.
Example: In the image below, for a relatively long period of time, we see a near -line value of 1, the near -zero line value, and the strong uptrend. Then, at the point where the crossover and the cross -line intersection occurs with the up, the price candle is also closed red, which is a sign of the possibility of changing the trend. At this point, after the signal confirmation, we can enter the sales position.

Comparison of Aaron Indicators with Other Ronance Indicators
It is not bad to know that the Aroon indicator is very similar to other indicators, including directional motion, a messenger, and average orientation index. In the following, we compare these indicators.
Compare Aaron and DMI
The Aaron indicator has similarities to the Directional Movement Index, or DMI, which by J. Wells Wilder was designed in Year 2. Both of these technical indicators use upward and downward lines to display the process, but their main difference is how to calculate and focus:
- The Aaron indicator focuses on the time between ceilings and precious floors, in other words “time -oriented”.
- In contrast, DMI focuses on the price difference between current ceilings and floors and the past, in other words “priced”.
Therefore, Aaron relies on time, while DMI emphasizes price changes.
Compare Aaron and MacD
The Aaron Index and the MacD-MacD (MACD) moving average are both tools for identifying price trends, but each from a different angle to market analysis:
- Aaron measures the strength and existence of the trend based on the time taken from the recent ceiling or floor.
- Mecca examines the changes over time, direction, strength, and faithful (acceleration of motion).
- McDed is more based on moving averages and is suitable for divergence and convergence signals.
As recommended in many technical analysis methods, a combination of indicators (eg Aaron with MacD) can provide a more comprehensive view of market status and prevent misconceptions.
Read more: What is the MacDi indicator (MACD)
Compare Aaron and ADX
The Aaron indicator and the average direct index or ADX are both used to identify the trend in the technical analysis, but two completely different paths come to this goal:
- Aaron is focused on time, and if it is a long time since the registration of a new roof, the line will not have much, indicating a poor uptrend. This index also determines the direction of the process.
- But ADX focuses on the amount of price changes and examines the amount of ceiling and floor changes compared to previous periods. This index does not show the direction of the process itself and the values of the di+ and di-should be compared.
What is Aaron or Aaron Indicator Single Line?
Along with the classic version of the Aaron Indicator (which includes two separate lines and Down), there is another version that combines both of these lines into a single -line indicator. This indicator is called the oscillator or Aroon Oscillator.
This version is obtained from the difference between the two lines of the UP and down, and like other oscillators, there is a value of 1 and +1 and only one line known as the Middle Zero Line.
Single -Line Aaron Signal Signal
Unlike the classic version, the signals in this version are very simple and direct:
- Passing from negative to positive (intersection from below to zero line) is a purchase signal and a possible uptrend.
- Passing from positive to negative (cross -to -down in zero line) is a sales signal and a possible downtrend start.
- The values close to the middle line indicate a lack of a neutral and stabilized trend or market that may appear before a new process is formed.
- Values above+ 1 indicate the formation of an upward trend.
- The values below -0 indicate the downward trend.
In the picture below, you can see the appearance of the single -line Aaron oscillator:

Aaron’s Indicator composition with other indicators
In order to make the trading signals more accurate and the errors less, it is best to combine the Aaron index with other tools, including:
Moving average (Moving Avege)
The moving average helps to identify the process. For example, if the UP line crosses the Down and the price is over the average of 6 days, we will probably have a strong upward trend.
MacDi (MacD)
McDea is an indicator for measuring the faithum and the strength of the movement:
- Ascending signalA: If the MacDi line passes through its signal line as well as the upward signal by Aaron.
- The descending signal: If the MacDi line passes down the signal line as well as the descending signal by Aaron.
Relative Power Index (RSI)
The relative power index is used to detect or sell saturation areas:
- High values of 2 in relative power index (purchase saturation)A: indicate the possibility of returning the trend to the downward and confirming the increase in the value of the Down line in the Aaron index.
- Values below 2 in relative power index (sales saturation)A: A sign of the possibility of the riverbank is ascending and confirmation of the increase in the amount of the Aaron UP line.
Aaron’s restrictions and challenges
Similar to any other tool, Aroon also has its own problems, including:
Poor signaling in oscillating markets
While the market is the so -called choppy market, rapid price fluctuations cause succession to travel in Aaron lines, which may lead to the issuance of wrong or confusing signals by this index.
Delay in signal issuance
While the issued signals may be correct, they are late and are very delayed. Therefore, the price may have already made its original move and is on the verge of returning, while the new Aaron exports the entry signal.
Focus only on time, not the intensity of price movement
Aaron focuses only for the past time from the recent ceiling or floor record, not how big or important that the price change has been. For this reason, this index may ignore strong but short -term or vibrant trends.
Inherent delay
Since Aaron operates on past data, it is inherently a delayed indicator and cannot immediately recognize the start of the process.
The possibility of wrong signals in short -term intervals
In short timing or unnecessary markets, this indicator may produce many false signals.
Frequently asked questions
The AROON indicator performs better in markets that are clear and stable. This index may give the wrong signals in or without the trend.
Aaron alone is not recommended. For higher accuracy, it is best to combine it with tools like MACD or RSI to verify the signals.
The 5 -day or 6 -day interval are the most common Aaron settings, but it can be changed depending on the trading style (short or long -term). The longer intervals are less fluctuating and give stronger signals.
Conclusion
Aroon is a technical tool for identifying the beginning, strength and end of the trends that operates based on the duration of the last roof or price. This indicator consists of two upper and lower (UP) and down lines and has a value of 1 to 2. Of course, the oscillator version of the Aaron is displayed as a line between -0 and +1.
Aaron signals appear especially when the lines intersection or crossing the zero line. The accuracy of this tool is high in markets, but in oscillating conditions it may provide false signals. For more accurate analysis, Aaron composition with indicators such as MACD or RSI is recommended.
RCO NEWS


