After the 55% growth of Ethereum in the first quarter of 2023, the analysis of Anchin and technical data shows that there is a possibility of the price increasing to the $3,000 range this season.
Ethereum price on the verge of possible breakout
According to Cointelegraph, after reaching the bottom of $880 in June and going through bearish events including the fall of the FTX exchange, the increase in bank interest rates and the intensification of legal actions against businesses in this field in the United States, the price of ethereum is more than 2 equaled
At the same time, an ascending trend line and a horizontal resistance have formed an ascending triangle pattern on the 3-day Ethereum chart. This pattern shows that while the peak price remains almost at a certain level, the price floor is continuously increasing with the pressure of buyers and indicates the increase of selling pressure near the resistance on the chart.
Since April 2 (April 13), the price of Ethereum has been trying to cross its horizontal resistance in the range of $1,700 to $1,820. Breakout will be confirmed when the closing of the price candle above the resistance zone is accompanied by an increase in trading volume. The price target after the breakout of this pattern will also be equal to the height of the triangle.
In other words, depending on which uptrend line (T1 and T2 in the chart above) traders consider as support, the price of Ethereum could rise to the $3,550-$3,900 range. This could mean the possibility of an 80% price increase until June.
Conversely, a pullback from the $1,700-$1,820 range carries the risk of delaying the start of the uptrend and a broader price correction.
Continuation of Ethereum accumulation by whales
From the perspective of such an analysis, the short-term and long-term trend of Ethereum price seems to be bullish.
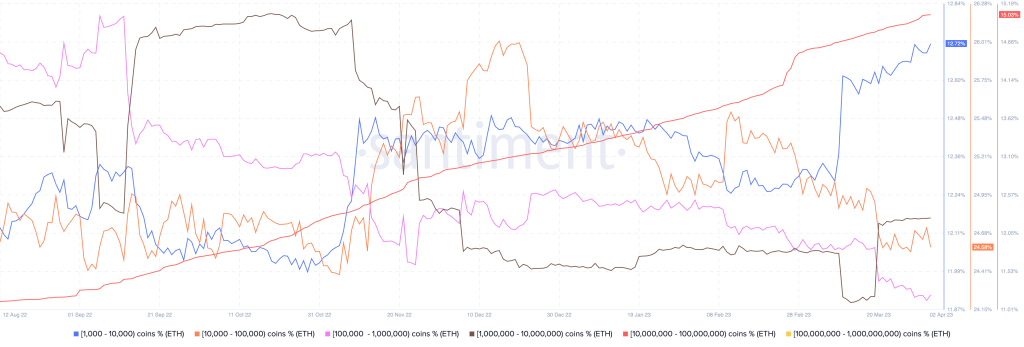
The latest data from the sentiment analysis platform shows that most Ethereum whale groups have increased their accumulation rate in recent weeks. For example, the portion of Ethereum’s supply held by addresses holding 1,000 to 10,000 tokens (blue in the chart below) increased by 0.5% in March.

Similarly, groups with holdings of 1 to 10 million ETH (brown) and 10 million to 100 million ETH (red) saw their share of supply increase by 0.4% and 0.5%, respectively.
This growth came amid what appears to be some selling pressure absorbed by groups holding 100,000 to 1 million ETH (pink) and 10,000 to 100,000 ETH (orange).
At the same time, this growth can be attributed to the increase in Ethereum that was directly or through intermediary platforms such as Lido DAO (Lido DAO) staked in Ethereum smart contracts.
The net amount of Ethereum staked in the official address of Ethereum 2.0 exceeded 18 million Ethereum after an increase of about 3.5% in March.
The amount of Ethereum staked has increased ahead of the April 12 (23rd) Shanghai and Shapla updates, which will allow investors to withdraw Ethereum. Currently, this is not possible.
MVRV Z-Score Index: Ethereum on the verge of an uptrend
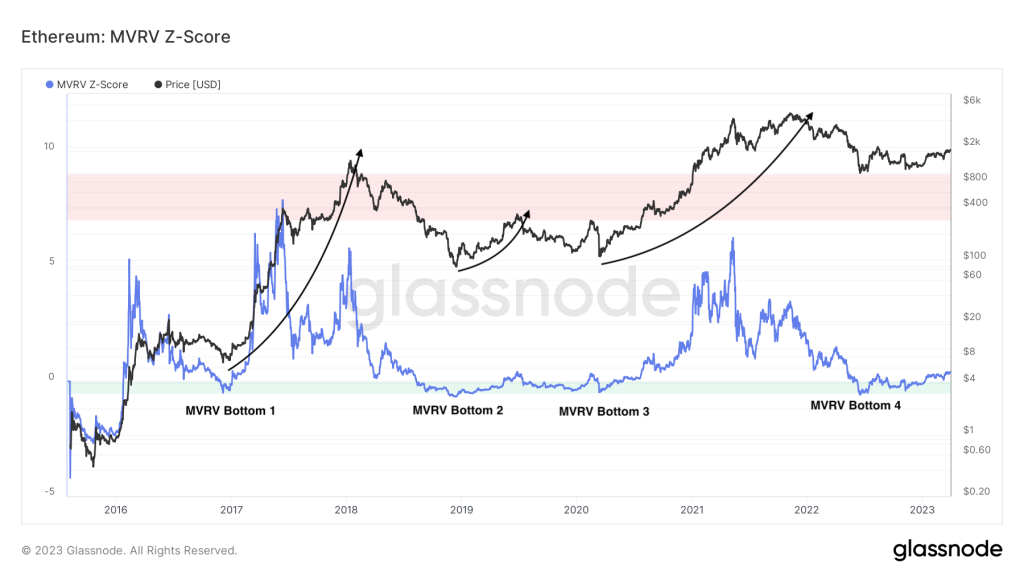
More bullish analysis is based on Ethereum’s “MVRV Z-Score” entering the stage it has been in before long-term bullish periods of Ethereum’s price in the past.

The MVRV Z-Score evaluates whether Ethereum is overvalued or undervalued relative to its fair (real) value. As a rule, the score of this index shows the market ceiling (red area) when the price in the market is higher than the realized value (red area) and the market floor (green area) in the opposite situation.
Ethereum’s previous uptrends have started at the same time as the MVRV Z-Score indicator has exited the green zone, indicating that this may happen in the next three months.
RCO NEWS


